Fig. 8
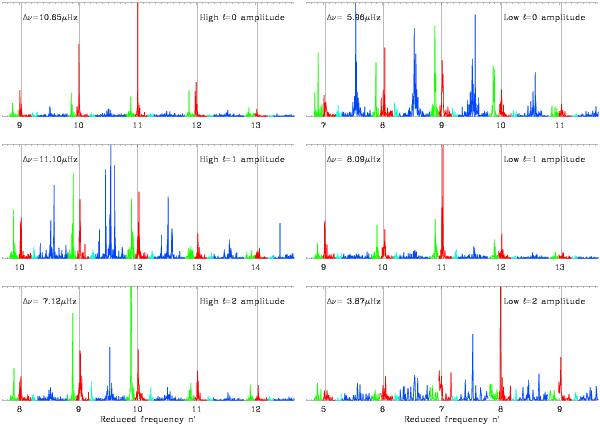
Identification of the ridges in red giants observed by Kepler. Targets were chosen with oscillation spectra exhibiting very different visibility coefficients (see Sect. 7). Left side: high visibility of ℓ = 0 to 2 from top to bottom. Right side: low visibility of ℓ = 0 to 2 from top to bottom. The spectra are corrected for the background contribution (negative values being omitted), and plotted as a function of the reduced frequency. The color code, derived from Eqs. (7) and (8), presents radial modes in red, ℓ = 1 in blue, ℓ = 2 in green, and ℓ = 3 in light blue.
Current usage metrics show cumulative count of Article Views (full-text article views including HTML views, PDF and ePub downloads, according to the available data) and Abstracts Views on Vision4Press platform.
Data correspond to usage on the plateform after 2015. The current usage metrics is available 48-96 hours after online publication and is updated daily on week days.
Initial download of the metrics may take a while.