Fig. 4
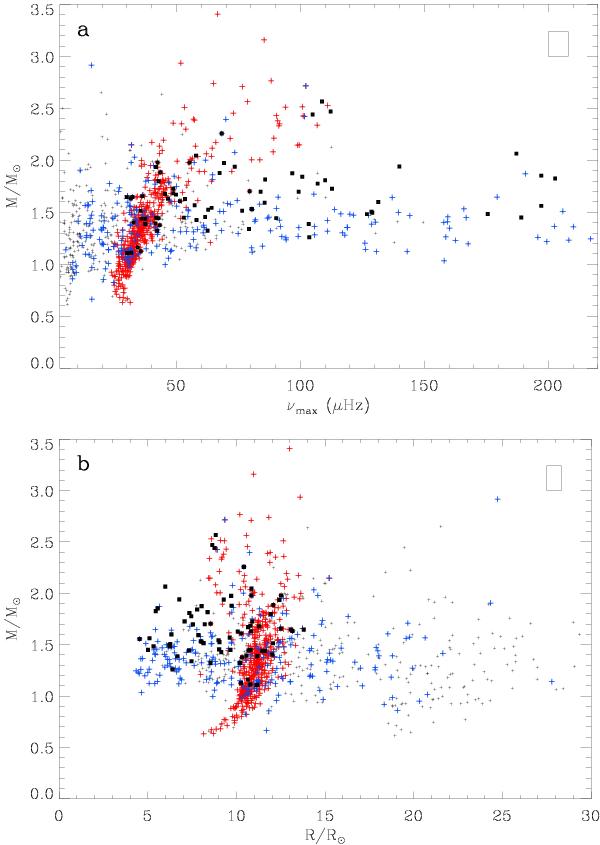
Asteroseismic mass as a function of νmax (panel a)) and of the asteroseismic radius (panel b)). The color code indicates the evolutionary status; clump stars in red, giant branch stars in blue, unknown status in dark grey. The population of giants with low ℓ = 1 amplitude (identified later in Sect. 7.1.1) is indicated with black squares. The rectangles in the upper right corners indicate the mean value of the 1-σ error bars.
Current usage metrics show cumulative count of Article Views (full-text article views including HTML views, PDF and ePub downloads, according to the available data) and Abstracts Views on Vision4Press platform.
Data correspond to usage on the plateform after 2015. The current usage metrics is available 48-96 hours after online publication and is updated daily on week days.
Initial download of the metrics may take a while.