Fig. 3
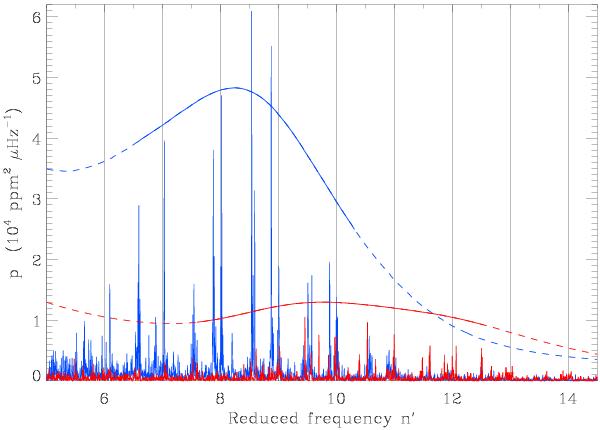
Comparison of two stars with similar large separations, one belonging to the RGB (KIC 4750456, Δν = 5.89 μHz, blue curve) and the other to the secondary clump (KIC 3758458, Δν = 5.87 μHz, red curve). The x-axis is the reduced frequency n′; vertical lines indicate radial modes. The dashed curves represent 20 times the smoothed spectra; the regions corresponding to the FWHM are overplotted with solid lines.
Current usage metrics show cumulative count of Article Views (full-text article views including HTML views, PDF and ePub downloads, according to the available data) and Abstracts Views on Vision4Press platform.
Data correspond to usage on the plateform after 2015. The current usage metrics is available 48-96 hours after online publication and is updated daily on week days.
Initial download of the metrics may take a while.