Fig. 2
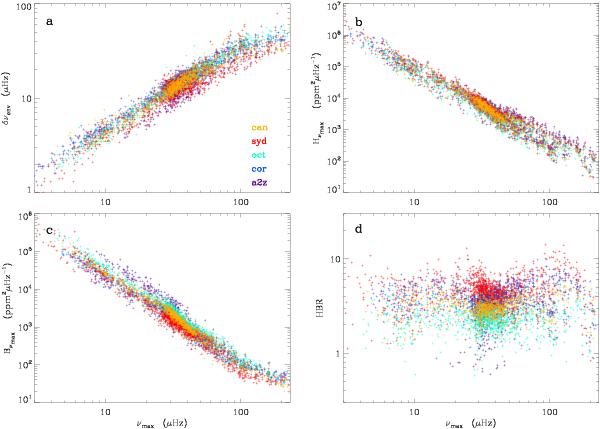
Global seismic parameters as a function of νmax derived from the five methods used here. a) FWHM δνenv of the Gaussian envelope; b) Mode height Hνmax, as defined by Eq. (1), corrected for apodization; c) Background at νmax. The increase above 200 μHz is an artefact due to the proximity of the Nyquist frequency. d) Height-to-background ratio, affected by the artefact on Bνmax. The color code indicates the method used for the data analysis, as indicated in panel a). The deviations from the trends above 200 μHz are due to the proximity to the Nyquist frequency.
Current usage metrics show cumulative count of Article Views (full-text article views including HTML views, PDF and ePub downloads, according to the available data) and Abstracts Views on Vision4Press platform.
Data correspond to usage on the plateform after 2015. The current usage metrics is available 48-96 hours after online publication and is updated daily on week days.
Initial download of the metrics may take a while.