Free Access
Fig. 12
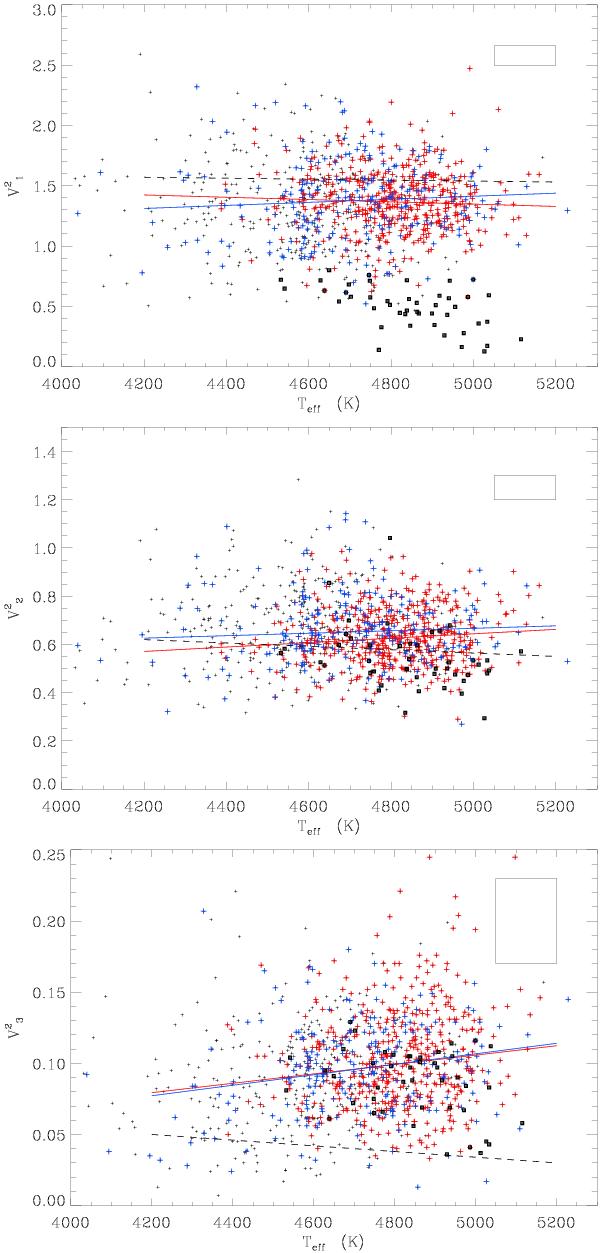
Visibility of the ℓ = 1, 2 and 3 modes (from top to bottom), as a function of the effective temperature. Same color code as in Fig. 11. Dashed lines are the fits derived from Ballot et al. (2011). Blue and red solid lines are the fits for RGB and clump stars, respectively.
This figure is made of several images, please see below:
Current usage metrics show cumulative count of Article Views (full-text article views including HTML views, PDF and ePub downloads, according to the available data) and Abstracts Views on Vision4Press platform.
Data correspond to usage on the plateform after 2015. The current usage metrics is available 48-96 hours after online publication and is updated daily on week days.
Initial download of the metrics may take a while.