Free Access
Fig. 10
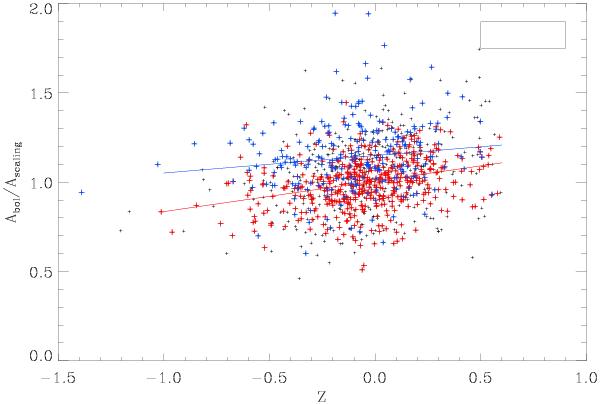
Variation in metallicity of the bolometric amplitude scaled to a best fit in L/M1.5. Same color code as in Fig. 4. The red and blue lines corresponds to the linear fits in Z. The uncertainties on Z are obtained from Brown et al. (2011).
Current usage metrics show cumulative count of Article Views (full-text article views including HTML views, PDF and ePub downloads, according to the available data) and Abstracts Views on Vision4Press platform.
Data correspond to usage on the plateform after 2015. The current usage metrics is available 48-96 hours after online publication and is updated daily on week days.
Initial download of the metrics may take a while.