Fig. 1
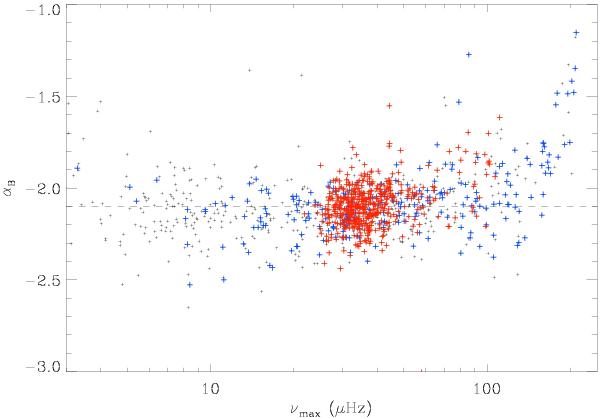
Local value of the exponent αB of the background as derived from Eq. (3), as a function of νmax. The dashed line indicates the median value estimated in the range [5, 120 μHz]. The increase of αB at large frequency is an artefact due to the Nyquist frequency. The color code indicates the evolutionary status: clump stars in red, red giant branch stars in blue, and undetermined status in black.
Current usage metrics show cumulative count of Article Views (full-text article views including HTML views, PDF and ePub downloads, according to the available data) and Abstracts Views on Vision4Press platform.
Data correspond to usage on the plateform after 2015. The current usage metrics is available 48-96 hours after online publication and is updated daily on week days.
Initial download of the metrics may take a while.