Fig. 9
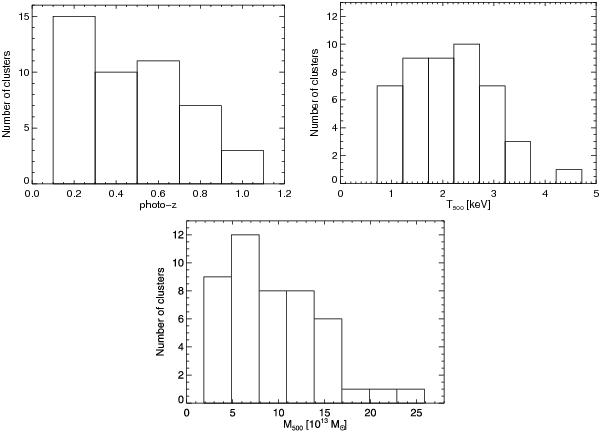
Top left: the redshift distribution of the 46 cluster sample based on the photometric redshifts obtained with the red sequence fitting method. Top right: the X-ray temperature distribution estimated from the L − T scaling relation of Pratt et al. (2009). Bottom: distribution of the cluster masses in the r500 aperture calculated from the luminosities using the L − M scaling relation from Pratt et al. (2009, see Sect. 3.3.
Current usage metrics show cumulative count of Article Views (full-text article views including HTML views, PDF and ePub downloads, according to the available data) and Abstracts Views on Vision4Press platform.
Data correspond to usage on the plateform after 2015. The current usage metrics is available 48-96 hours after online publication and is updated daily on week days.
Initial download of the metrics may take a while.