Fig. 8
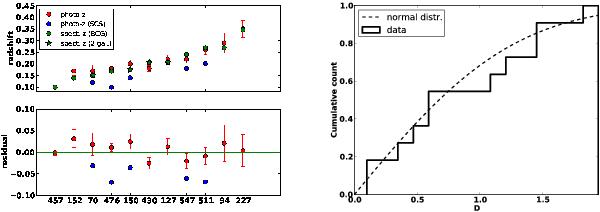
Consistency test of our photometric redshift estimates with spectroscopic measurements in the redshift range z = 0−0.4. Left: comparison of our photometric redshift estimates (red, 1σ error bars) with spectroscopic values (green). Green stars mark clusters for which we have two concordant galaxy redshifts, while green circles indicate clusters for which only the BCG has a spectroscopic redshift. The photometric redshifts obtained by the SCS survey (M09, M10) are shown in blue. The x-axis displays the cluster ID number. The objects are sorted in increasing redshift order. The bottom panel shows the residuals of the photo-z values with respect to the spectroscopic measurement. Right: cumulative histogram of the difference between the photometric and spectroscopic redshift normalized by the 1σ uncertainty of the photo-z values, i.e. D = |zphoto − zspec|/σphoto. The dashed line shows the expectation for the Gaussian distribution. Both curves are in good agreement, with a Kolmogorov-Smirnov test confirming that the distribution of the D values is Gaussian at the 96% confidence level.
Current usage metrics show cumulative count of Article Views (full-text article views including HTML views, PDF and ePub downloads, according to the available data) and Abstracts Views on Vision4Press platform.
Data correspond to usage on the plateform after 2015. The current usage metrics is available 48-96 hours after online publication and is updated daily on week days.
Initial download of the metrics may take a while.