Free Access
Fig. 7
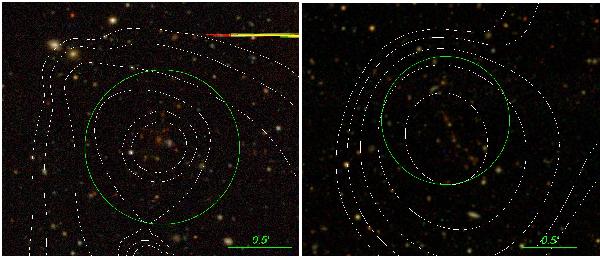
Pseudo-color images in the gri bands of the two X-ray detected (white contours) systems with secure photo-z values above z > 0.9. Green circles mark the 0.5 × r500 radius. Both clusters have a BCG coincident with the center of the X-ray detection.
This figure is made of several images, please see below:
Current usage metrics show cumulative count of Article Views (full-text article views including HTML views, PDF and ePub downloads, according to the available data) and Abstracts Views on Vision4Press platform.
Data correspond to usage on the plateform after 2015. The current usage metrics is available 48-96 hours after online publication and is updated daily on week days.
Initial download of the metrics may take a while.