Fig. 5
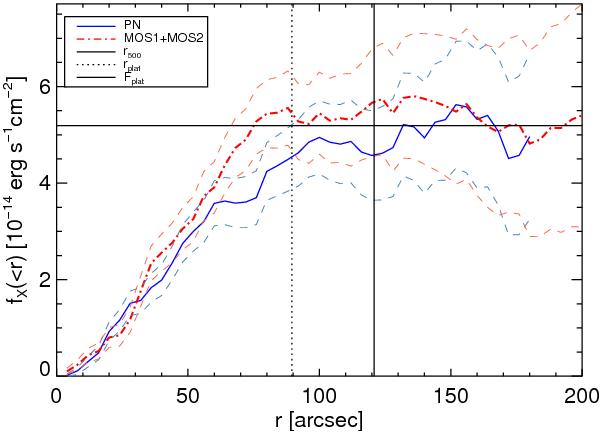
Example of the growth curve analysis of source ID 018 (photo-z = 0.39). The cluster’s redshift and luminosity are close to the median values of the entire sample. The curves show the encircled cumulative flux as a function of radius (PN: blue curve, combined MOS: red, dot-dashed). The PN and MOS curves are in good agreement. Dashed lines mark the flux measurement error bars which include the Poisson noise and an additional 5% systematic error from the background estimation. The estimated plateau flux is Fplat = 5.19 × 10⁻¹⁴ erg s-1 cm-2 (horizontal line), reached at rplat ~ 90 arcsec. The vertical line signifies the estimated r500 radius of the source, r500 = 0.6 Mpc (~117 arcsec). In this case, the plateau radius is slightly smaller than r500 and the flux and luminosity for r500 had to be extrapolated from their plateau values. The required extrapolation is only ~2% in this case. See Sect. 3.3 for details.
Current usage metrics show cumulative count of Article Views (full-text article views including HTML views, PDF and ePub downloads, according to the available data) and Abstracts Views on Vision4Press platform.
Data correspond to usage on the plateform after 2015. The current usage metrics is available 48-96 hours after online publication and is updated daily on week days.
Initial download of the metrics may take a while.