Fig. 4
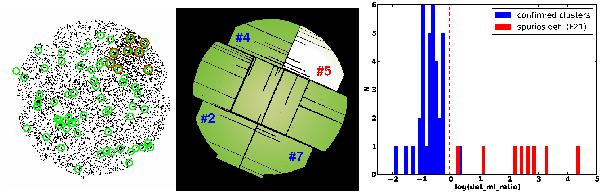
Left: image of field F21 taken by the MOS2 camera in the 0.5−2.0 keV band. The MOS2 CCD#5 is visibly in an anomalously high (“hot”) state with an enhanced background. Sources detected in this field are marked by green circles. Sources with red circles were automatically flagged as possibly spurious detections caused by the presence of the hot chip. Middle: a composite background model for the same detector and band created by fitting the double component model independently to the CCD#5 and the rest of the chips. The three blue-marked chips are the reference chips used to identify hot chips in the observations. Right: the ratio of the total detection likelihood (log scale) from the MOS2 CCD#5 in the 0.3−0.5 and 0.5−2.0 keV bands to the total detection likelihoods from all other detectors and bands (log scale). Blue bars show the confirmed clusters from our sample, the red bars the 8 flagged sources from field F21 (from the left panel). The vertical line marks where the soft band MOS2 detection constitutes 90% of the total detection likelihoods in all detectors. The flagged sources were confirmed as spurious by the optical data. A single confirmed cluster (ID 275) appears above the threshold, but is not flagged as spurious since it would have been above the detection likelihood even without the MOS2 detection (i.e. not meeting all the required criteria described in Sect. 3.1.1).

Current usage metrics show cumulative count of Article Views (full-text article views including HTML views, PDF and ePub downloads, according to the available data) and Abstracts Views on Vision4Press platform.
Data correspond to usage on the plateform after 2015. The current usage metrics is available 48-96 hours after online publication and is updated daily on week days.
Initial download of the metrics may take a while.