Fig. 3
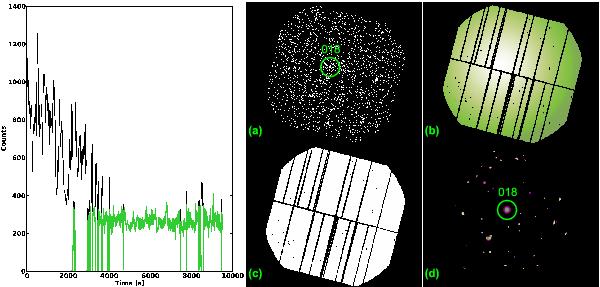
Left: the black line shows the 10 second-binned PN light curve in the 0.3−10 keV band for the field F04. The beginning of the observation was affected by flaring. The green curve shows the light curve after the two-step cleaning (see Sect. 2), which safely removed all contaminated time intervals. Right: examples of the detection pipeline products for field F04 in the 0.5−2 keV band of the PN detector: a) counts image, b) double-component background model, c) binary detection mask, d) reconstruction of all the detected sources. The green circle (2 arcmin radius) marks the cluster ID 018.
Current usage metrics show cumulative count of Article Views (full-text article views including HTML views, PDF and ePub downloads, according to the available data) and Abstracts Views on Vision4Press platform.
Data correspond to usage on the plateform after 2015. The current usage metrics is available 48-96 hours after online publication and is updated daily on week days.
Initial download of the metrics may take a while.