Fig. 2
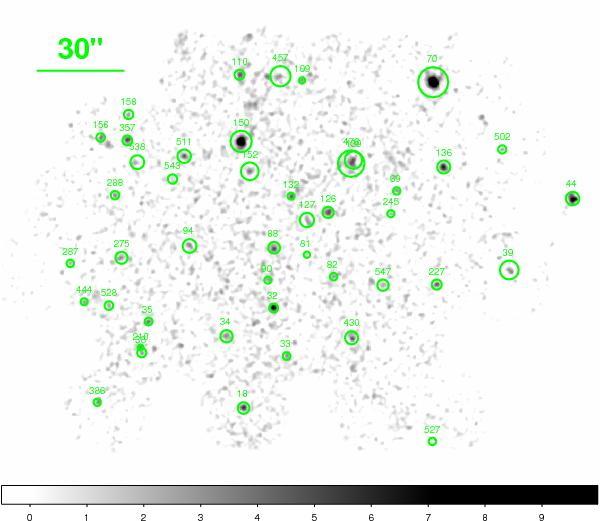
The 0.5 − 2 keV band signal-to-noise ratio map of the XMM-BCS core region (region F in Fig. 1) smoothed with a Gaussian of 32′′ width. Circles indicate the r500 radii of the detected clusters and are labeled with the cluster ID number in the catalog. Point sources have been subtracted using the method of Finoguenov et al. (2009).
Current usage metrics show cumulative count of Article Views (full-text article views including HTML views, PDF and ePub downloads, according to the available data) and Abstracts Views on Vision4Press platform.
Data correspond to usage on the plateform after 2015. The current usage metrics is available 48-96 hours after online publication and is updated daily on week days.
Initial download of the metrics may take a while.