Free Access
Fig. C.2
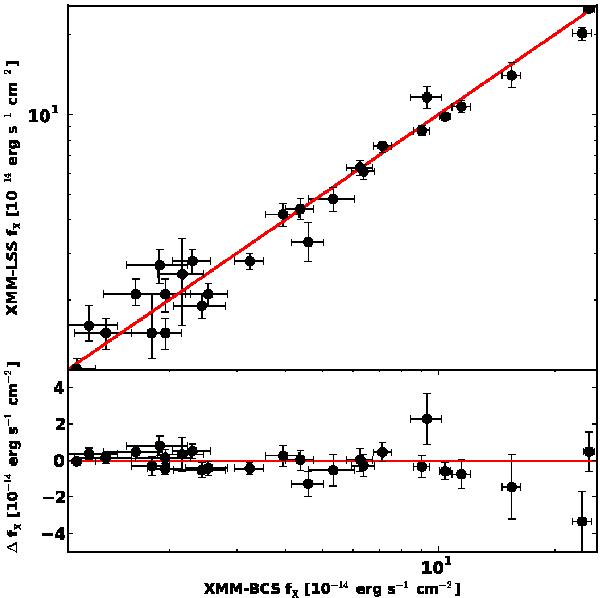
Comparison of measured X-ray fluxes for the C1 subsample of the XMM-LSS survey in the 0.5 − 2 keV band and a 0.5 Mpc aperture (Pacaud et al. 2007, y-axis) and the fluxes measured by our pipeline (x-axis). The red line marks equality. The bottom panel shows the residuals  . See Sect. C.2 for details.
Current usage metrics show cumulative count of Article Views (full-text article views including HTML views, PDF and ePub downloads, according to the available data) and Abstracts Views on Vision4Press platform.
Data correspond to usage on the plateform after 2015. The current usage metrics is available 48-96 hours after online publication and is updated daily on week days.
Initial download of the metrics may take a while.