Fig. B.1
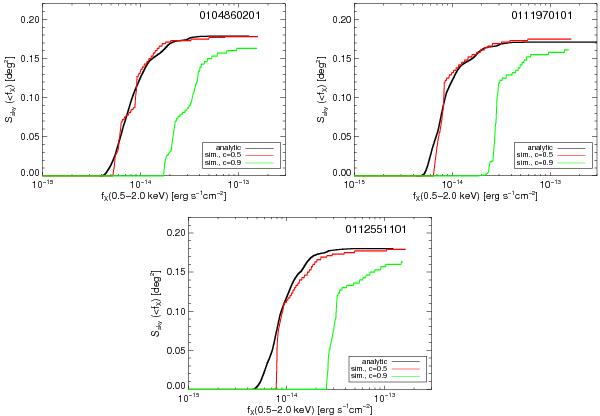
Sky-coverage for extended sources in three XDCP fields from Monte Carlo simulations at the 50% (red curve) and 90% (green) completeness level. The black solid curve shows the sky-coverage calculated by scaling the point source curve (dashed) with an offset factor of 2.4 (see Sect. 5.2). The simple scaling is shown to be a good first order description of the extended source sensitivity function. See Appendix B and Sect. 5.2 for details.
Current usage metrics show cumulative count of Article Views (full-text article views including HTML views, PDF and ePub downloads, according to the available data) and Abstracts Views on Vision4Press platform.
Data correspond to usage on the plateform after 2015. The current usage metrics is available 48-96 hours after online publication and is updated daily on week days.
Initial download of the metrics may take a while.