Fig. 12
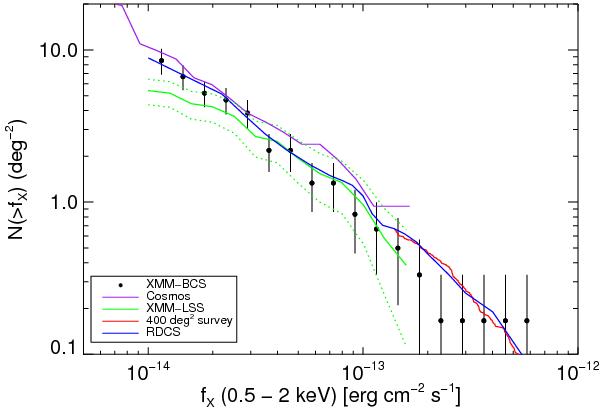
The log N − log S of the present sample in the 0.5 − 2.0 keV band. Fluxes are calculated in the r500 aperture. Results from several surveys are also shown: COSMOS (Finoguenov et al. 2007), RDCS (the ROSAT Deep Cluster Survey, Rosati et al. 1998), 400 deg2 survey (Burenin et al. 2007; Vikhlinin et al. 2009) and the XMM-LSS (Pacaud et al. 2007). See Sect. 5.3 for details.
Current usage metrics show cumulative count of Article Views (full-text article views including HTML views, PDF and ePub downloads, according to the available data) and Abstracts Views on Vision4Press platform.
Data correspond to usage on the plateform after 2015. The current usage metrics is available 48-96 hours after online publication and is updated daily on week days.
Initial download of the metrics may take a while.