Fig. 10
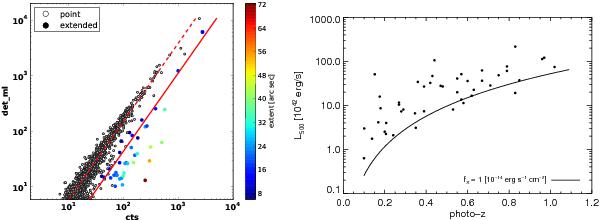
Left: detection likelihood (det_ml) as a function of total detected source counts (PN detector only) for point sources (open circles) and the detected clusters (full circles). Clusters are color coded by their extent (beta model core radius). The dashed red line shows the best fit linear relation in the det_ml – counts plane for point sources. The solid line shows the same relation for extended sources (with slope fixed to the point-source fit, points weighted by their counts error). Typically, an extended source has to have 2.4 times more counts than a point source to be detected at the same det_ml value. See Sect. 5.2 for details. Right: luminosity in the 0.5−2 keV band (object rest-frame) for the present cluster sample as a function of redshift. The line shows the luminosity of a cluster with a measured flux of 1 × 10¹⁴ erg s-1 cm-2 (unabsorbed, observer rest-frame).
Current usage metrics show cumulative count of Article Views (full-text article views including HTML views, PDF and ePub downloads, according to the available data) and Abstracts Views on Vision4Press platform.
Data correspond to usage on the plateform after 2015. The current usage metrics is available 48-96 hours after online publication and is updated daily on week days.
Initial download of the metrics may take a while.