Fig. 1
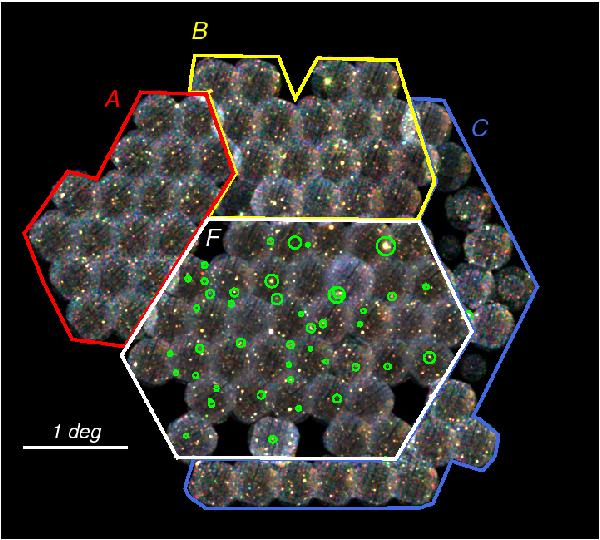
Mosaic X-ray image of the 14 deg2XMM-Newton sky survey. The false color image was constructed from the surface brightness in the 0.3−0.5, 0.5−2.0 and 2.0−4.5 keV bands. The white region (F) marks the 6 deg2 core of the survey presented in this work. Regions A, B and C constitute the extension of the survey by mosaic mode observations. The missing fields have significant losses due to soft proton flares. Bluer fields are affected by enhanced background. Green circles mark the positions of the present cluster sample and have a radius equal to r500.
Current usage metrics show cumulative count of Article Views (full-text article views including HTML views, PDF and ePub downloads, according to the available data) and Abstracts Views on Vision4Press platform.
Data correspond to usage on the plateform after 2015. The current usage metrics is available 48-96 hours after online publication and is updated daily on week days.
Initial download of the metrics may take a while.