Fig. 7
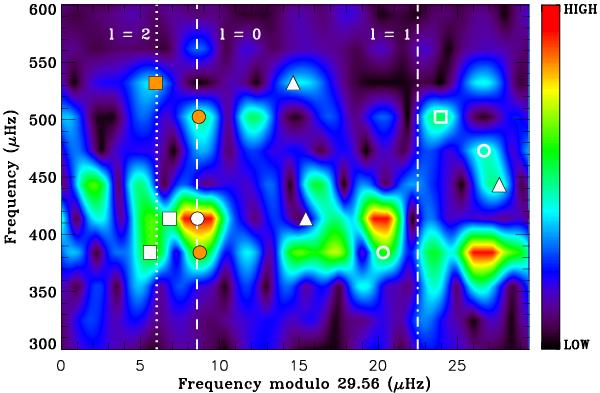
Échelle diagram overlaid on the amplitude spectrum with a colored background scale. The filled symbols (white and orange) represent the identified modes for ℓ = 0 (circles), ℓ = 1 (triangles) and ℓ = 2 (squares). The orange symbols are the frequencies shifted for the daily gap of ± 11.57 μHz while the open symbols correspond to the original unshifted values. The ridges derived from the fit to the asymptotic relation (4) are also marked.
Current usage metrics show cumulative count of Article Views (full-text article views including HTML views, PDF and ePub downloads, according to the available data) and Abstracts Views on Vision4Press platform.
Data correspond to usage on the plateform after 2015. The current usage metrics is available 48-96 hours after online publication and is updated daily on week days.
Initial download of the metrics may take a while.