Fig. 5
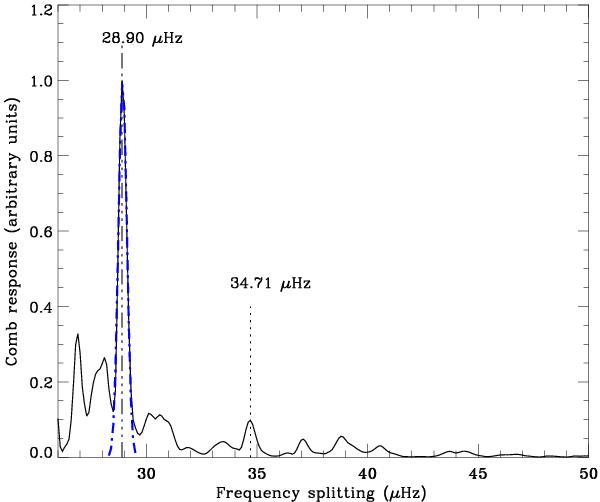
Cumulative comb-response obtained as the sum of the individual comb-responses for each central frequency ν0 with amplitude >0.5 m s-1 (S/N ≳ 3.5) in the amplitude spectrum. The maximum peak is centered at Δν = 28.90 ± 0.45 μHz where the uncertainty is evaluated as the FWHM of the Gaussian used to fit the peak (blue dot-dashed curve). The second marked peak on the right, centered at 34.71 μHz, represents three times the daily spacing.
Current usage metrics show cumulative count of Article Views (full-text article views including HTML views, PDF and ePub downloads, according to the available data) and Abstracts Views on Vision4Press platform.
Data correspond to usage on the plateform after 2015. The current usage metrics is available 48-96 hours after online publication and is updated daily on week days.
Initial download of the metrics may take a while.