Fig. 1
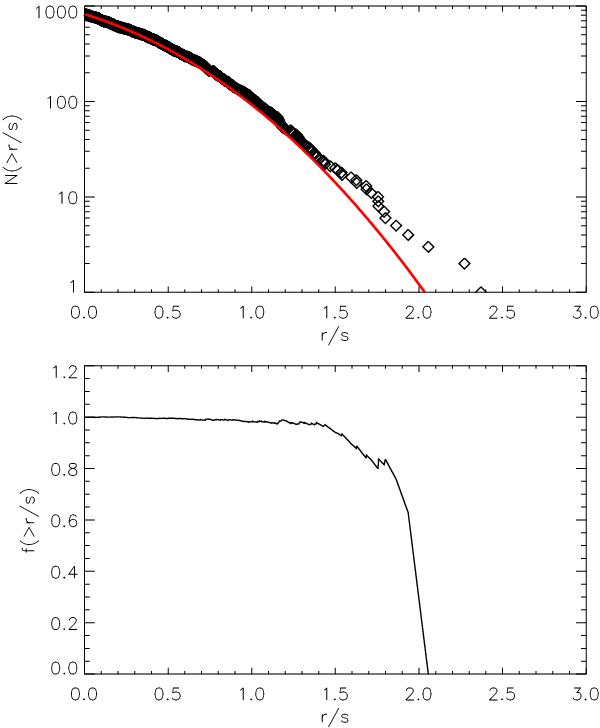
Upper panel: cumulative histograms of |ri/σi| for SARG data. The diamonds show the observed data, and the solid curve shows the result expected for a Gaussian-distributed noise. Lower panel: ratio f of the observed to the expected histograms, indicating the fraction of “good” data points. An excess of outliers is evident for |ri/σi| ≳ 1.5.
Current usage metrics show cumulative count of Article Views (full-text article views including HTML views, PDF and ePub downloads, according to the available data) and Abstracts Views on Vision4Press platform.
Data correspond to usage on the plateform after 2015. The current usage metrics is available 48-96 hours after online publication and is updated daily on week days.
Initial download of the metrics may take a while.