Fig. 9
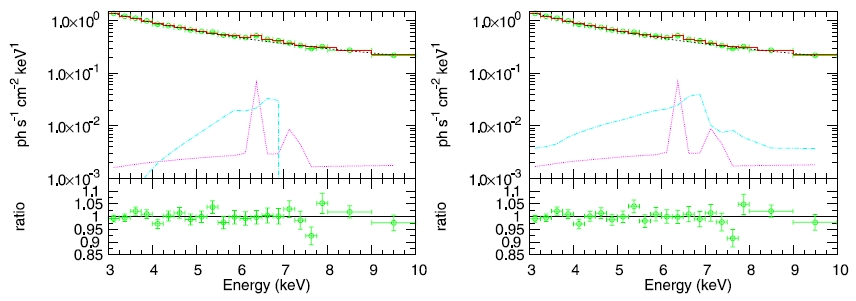
Left panel shows spectral fits to the “averaged X-ray spectrum” using a model including a power law, a distant neutral reflector and a diskline (mo pow+pexmon+diskline). Right panel displays the spectral fit including a power law and dual reflector spectra (mo pow+pexmon+kdblur ∗ pexmon). In both figures the bottom panels show respective data/model ratios.
Current usage metrics show cumulative count of Article Views (full-text article views including HTML views, PDF and ePub downloads, according to the available data) and Abstracts Views on Vision4Press platform.
Data correspond to usage on the plateform after 2015. The current usage metrics is available 48-96 hours after online publication and is updated daily on week days.
Initial download of the metrics may take a while.