Fig. 7
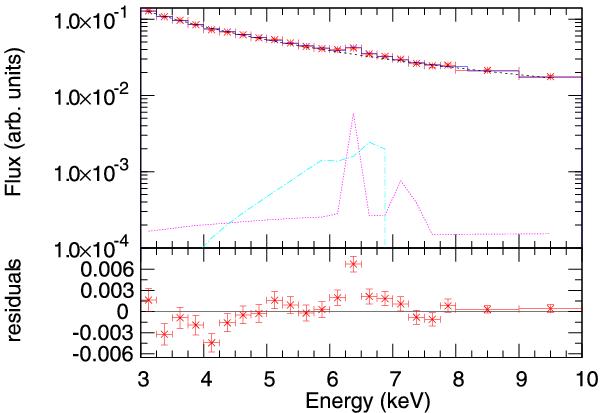
Top panel shows spectral fit to the “averaged ratio flux spectrum” using a model including a power law, a distant neutral reflector and a diskline (mo pow+pexmon+diskline) along with the model components. Residuals (with the pexmon and diskline normalizations set to zero for illustration purposes) are shown in the bottom panel.
Current usage metrics show cumulative count of Article Views (full-text article views including HTML views, PDF and ePub downloads, according to the available data) and Abstracts Views on Vision4Press platform.
Data correspond to usage on the plateform after 2015. The current usage metrics is available 48-96 hours after online publication and is updated daily on week days.
Initial download of the metrics may take a while.