Free Access
Fig. 4
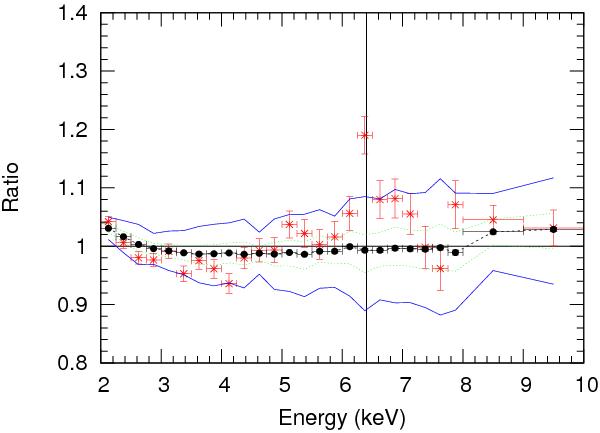
Averaged ratio of the 248 spectra after applying 3-sigma clipping (red), mean simulated continuum (black) along with its 1σ (green dotted line) and 3σ (blue solid line) confidence limits. The solid vertical line is drawn at 6.4 keV.
Current usage metrics show cumulative count of Article Views (full-text article views including HTML views, PDF and ePub downloads, according to the available data) and Abstracts Views on Vision4Press platform.
Data correspond to usage on the plateform after 2015. The current usage metrics is available 48-96 hours after online publication and is updated daily on week days.
Initial download of the metrics may take a while.