Fig. 11
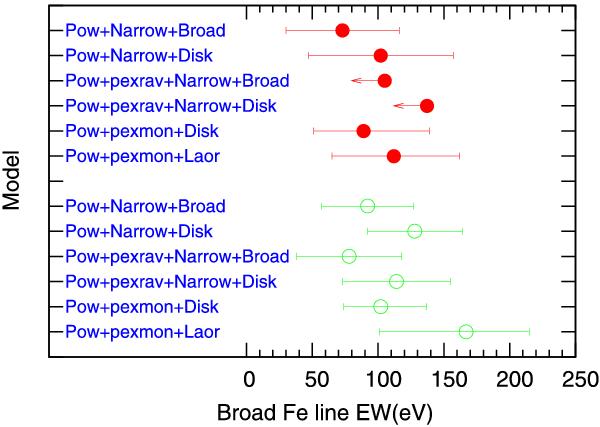
Comparison of the equivalent width of the broad Fe Kα line measured from the spectral fitting of the “averaged ratio flux spectrum (red) and “averaged X-ray spectrum” (green) of the total sample comprising 248 AGNs. Respective deterministic model is listed in blue. Errors and upper limits are drawn at the 68% confidence level.
Current usage metrics show cumulative count of Article Views (full-text article views including HTML views, PDF and ePub downloads, according to the available data) and Abstracts Views on Vision4Press platform.
Data correspond to usage on the plateform after 2015. The current usage metrics is available 48-96 hours after online publication and is updated daily on week days.
Initial download of the metrics may take a while.