Free Access
Fig. 4
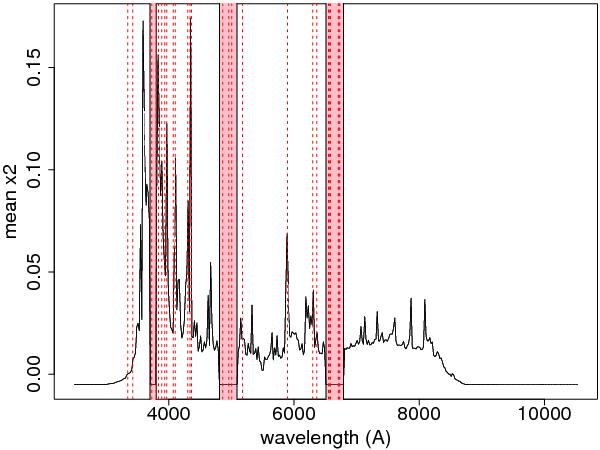
The mean reduced χ2 value for all the spectra of SDSS with the best fitted synthetic spectrum for every wavelength. The red dotted lines represent the wavelengths were emission lines occur, while the red areas represent the areas of the spectrum that were masked during the χ2-fitting.
Current usage metrics show cumulative count of Article Views (full-text article views including HTML views, PDF and ePub downloads, according to the available data) and Abstracts Views on Vision4Press platform.
Data correspond to usage on the plateform after 2015. The current usage metrics is available 48-96 hours after online publication and is updated daily on week days.
Initial download of the metrics may take a while.