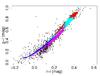
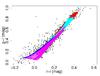
Fig. 13
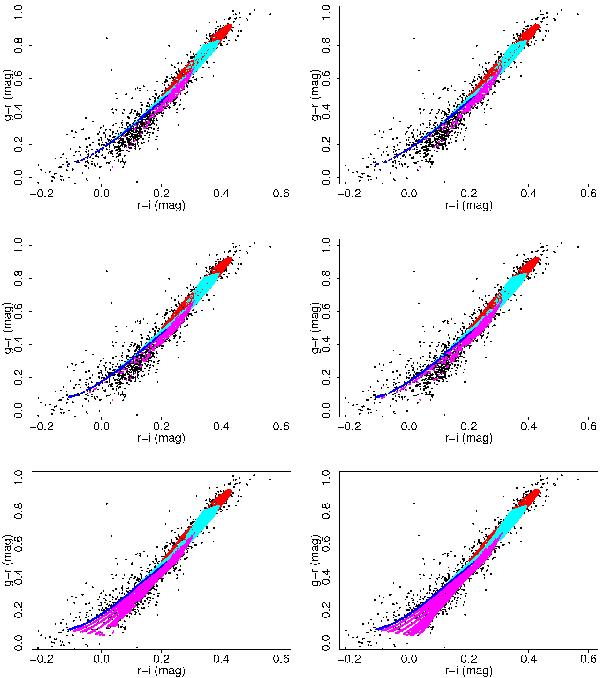
The synthesized color–color diagram for the synthetic spectra of galaxies which were accepted in each case based on their χ2 values from the fitting to SDSS spectra. We show the cases with χ2 limit less than 0%, 0.2%, 0.5% and 1% and 5% greater than the minimum χ2 value respectively. The bottom right plot presents the color–color diagram for all the spectra in the second library. The notation of the colors is the same as in Fig. 1.

Current usage metrics show cumulative count of Article Views (full-text article views including HTML views, PDF and ePub downloads, according to the available data) and Abstracts Views on Vision4Press platform.
Data correspond to usage on the plateform after 2015. The current usage metrics is available 48-96 hours after online publication and is updated daily on week days.
Initial download of the metrics may take a while.