Free Access
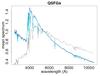
Fig. 12
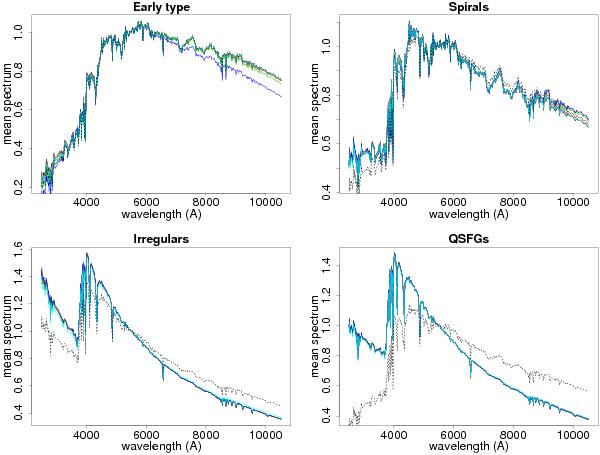
The same as Fig. 11 but for the synthetic spectra that were excluded based on the χ2 criterion. The black dotted line represents the average accepted spectrum corresponding to the minimum χ2 value.
This figure is made of several images, please see below:
Current usage metrics show cumulative count of Article Views (full-text article views including HTML views, PDF and ePub downloads, according to the available data) and Abstracts Views on Vision4Press platform.
Data correspond to usage on the plateform after 2015. The current usage metrics is available 48-96 hours after online publication and is updated daily on week days.
Initial download of the metrics may take a while.