Free Access
Fig. 6
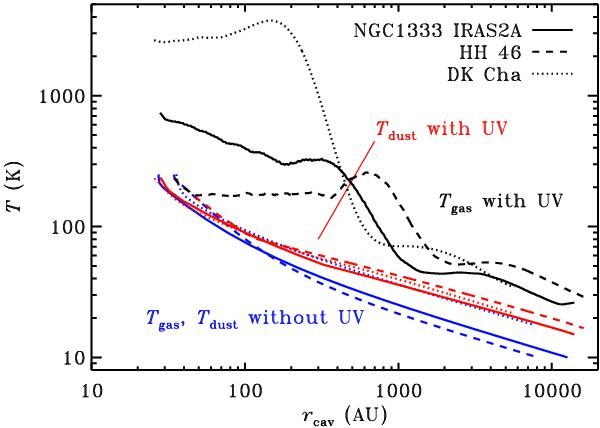
Gas temperature (black) and dust temperature (red) along the cavity wall of the three sources due to UV heating. Shocks are not included. The coordinate on the horizontal axis is the distance to the protostar (Eq. (2)). The blue curves show the temperature profiles due to passive heating only (gas and dust coupled).
Current usage metrics show cumulative count of Article Views (full-text article views including HTML views, PDF and ePub downloads, according to the available data) and Abstracts Views on Vision4Press platform.
Data correspond to usage on the plateform after 2015. The current usage metrics is available 48-96 hours after online publication and is updated daily on week days.
Initial download of the metrics may take a while.