Fig. 3
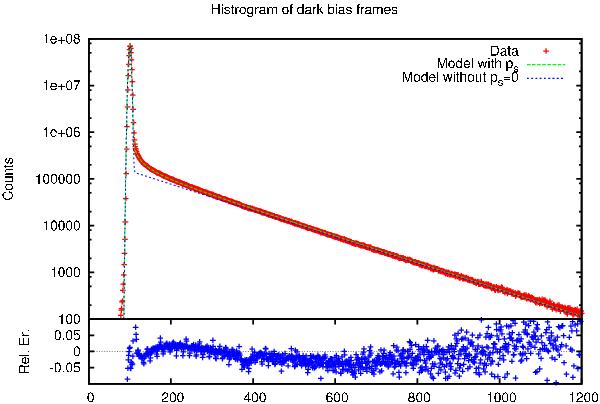
Histogram of pixel readout values of 500 bias frames, in total about 5.25 × 108 pixels. The best fit model to the data, with and without the sCIC term, is over-plotted. The lower panel represent the relative error between the model with sCIC and the data, defined as δ = (di − mi)/mi, where m is the model and d is data. Because of the large number of pixels in the histogram, even small effects, which can not be fitted by a simple model, may become evident. A Fourier analysis of the difference residuals shows a clear peak of 62 counts at 16, which is probably from imperfections in the AD converter. The value from the readout amplifier is a 16bit binary number, and a period of 16 means that there is an imperfection in the fourth bit (24 = 16). In the transition from the bell to the exponential arm there is a deviation in a small region, which can be understood as being due to the simplifications done to the equations to make them computationally manageable.
Current usage metrics show cumulative count of Article Views (full-text article views including HTML views, PDF and ePub downloads, according to the available data) and Abstracts Views on Vision4Press platform.
Data correspond to usage on the plateform after 2015. The current usage metrics is available 48-96 hours after online publication and is updated daily on week days.
Initial download of the metrics may take a while.