Fig. 13
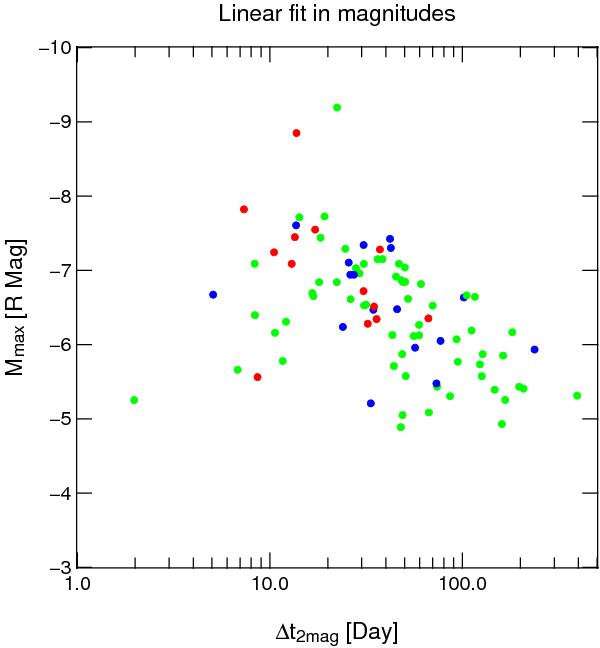
Distribution of the observed apparent maximum brightness in R-band and the fitted t2 for all nova candidates. The red and blue points refer to Eq. (3) with t0 as free parameter and Eq. (4) with t0 as fixed parameter, respectively. The green points are novae that belong to other classes. The t2 value is derived from the dm/dt and the observed apparent maximum in the light curves. See the main text for a detailed description.
Current usage metrics show cumulative count of Article Views (full-text article views including HTML views, PDF and ePub downloads, according to the available data) and Abstracts Views on Vision4Press platform.
Data correspond to usage on the plateform after 2015. The current usage metrics is available 48-96 hours after online publication and is updated daily on week days.
Initial download of the metrics may take a while.