Fig. 5
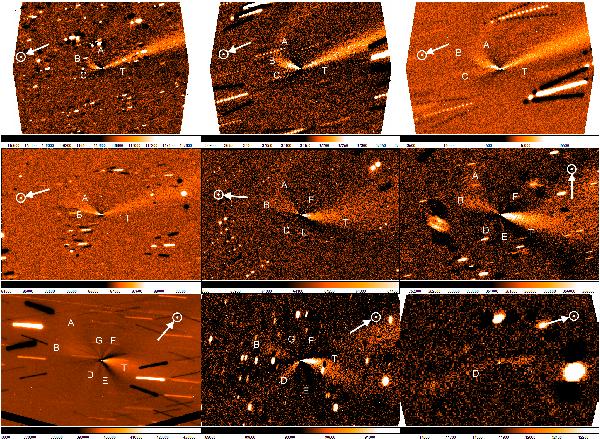
Images after processing by the Larson-Sekanina algorithm taken on January 14, 17 and 18, (top, from left to right) February 26, April 7, 24 (middle, from left to right) May 4, May 20, August 1 (bottom, from left to right). In all images, north is up, east is to the left. The field of view is 5.85′ × 3.87′. The arrow points in the solar projection direction. Structures are identified with capital letters, and T marks the position of the dust tail. All images were obtained with a broadband R-filter.
Current usage metrics show cumulative count of Article Views (full-text article views including HTML views, PDF and ePub downloads, according to the available data) and Abstracts Views on Vision4Press platform.
Data correspond to usage on the plateform after 2015. The current usage metrics is available 48-96 hours after online publication and is updated daily on week days.
Initial download of the metrics may take a while.