Fig. 2
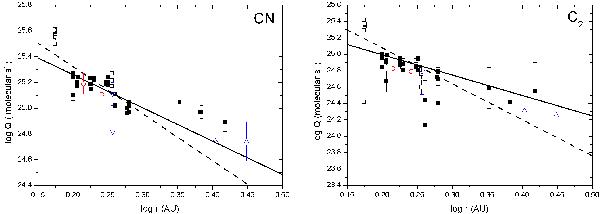
Log of production rates for CN (left) and C2 (right) plotted as a function of the log of the heliocentric distance. Different symbols come from different data sets; opened square, filled symbols and opened inverse-triangle are the data from four apparitions (1978 ~ 2003) taken by Farnham et al. (2005). The open circle and triangle symbols are the data taken from the Lulin observatory in 2010 and from La Silla in 2004, respectively. Notice that the data from 2003 ~ 2004 are all represented by triangle symbols. Two different results of the linear fitting are present. The dash line is representative of all data obtained from 1978 to 2010 and the solid line is for all data obtained from 1983 to 2010.
Current usage metrics show cumulative count of Article Views (full-text article views including HTML views, PDF and ePub downloads, according to the available data) and Abstracts Views on Vision4Press platform.
Data correspond to usage on the plateform after 2015. The current usage metrics is available 48-96 hours after online publication and is updated daily on week days.
Initial download of the metrics may take a while.