Fig. 8
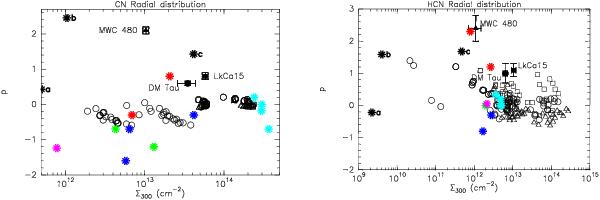
Value of Σ300 and p for the three sources DM Tau (circle), LkCa 15 (square), and MWC 480 (triangle). Our observations are plotted in filled black markers, the results from the PDR chemical modeling are in open markers. In the DM Tau case, we also plot the results with the photodissociation rates calculated for a black body at 4000 K from van Dishoeck et al. (2006). Results from the literature are marked with stars; red: Aikawa & Herbst (1999); green: Aikawa et al. (2002); blue: van Zadelhoff et al. (2003); cyan: Aikawa & Nomura (2006); magenta: Willacy & Langer (2000); and black: Willacy et al. (2006) (a, b and c correspond to their K = 0,K = 1016 and K = 1018 cases). The error bars show the power-law fitting errors (1σ).
Current usage metrics show cumulative count of Article Views (full-text article views including HTML views, PDF and ePub downloads, according to the available data) and Abstracts Views on Vision4Press platform.
Data correspond to usage on the plateform after 2015. The current usage metrics is available 48-96 hours after online publication and is updated daily on week days.
Initial download of the metrics may take a while.