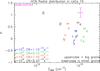
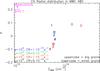
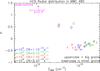
Fig. B.1
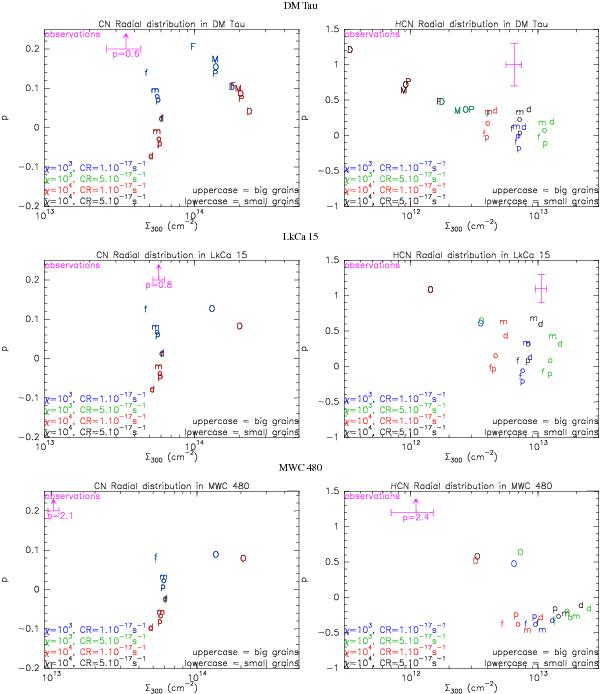
Value of Σ300 and p from our chemistry modeling for the three sources, with our “standard” chemistry. o: density and temperature from theoretical models, p: temperature increased by 30%, m: temperature decreased by 30%, f: density multiplied by a factor 3 and d: density divided by a factor 3. In many models the blue and green markers overlap, as do the red and black ones.
Current usage metrics show cumulative count of Article Views (full-text article views including HTML views, PDF and ePub downloads, according to the available data) and Abstracts Views on Vision4Press platform.
Data correspond to usage on the plateform after 2015. The current usage metrics is available 48-96 hours after online publication and is updated daily on week days.
Initial download of the metrics may take a while.