Fig. 8
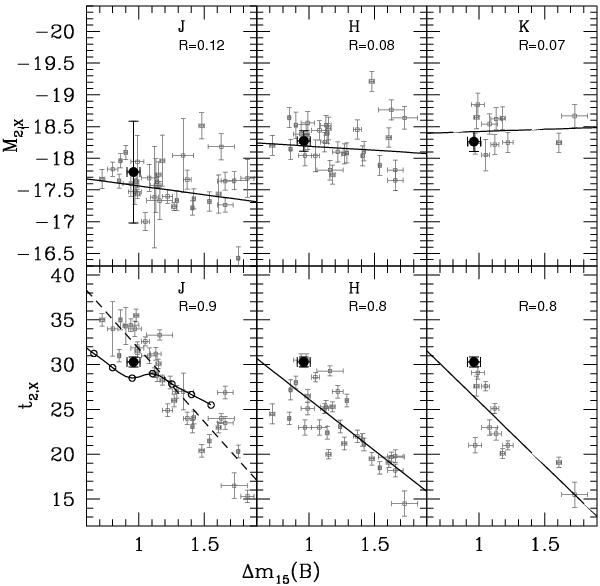
The time since B maximum of secondary NIR peak (lower panel) and the absolute magnitude of secondary peak (upper panel) versus the Δm15(B). SN 2008fv is represented with large circles, the data from literature with small open squares. The Pearson coefficients R is also shown for each panel with the resulting best fit of data (solid line). For the timing of secondary maximum in J-band, we also plot the prediction of Kasen (2006) models (solid line and open circles).
Current usage metrics show cumulative count of Article Views (full-text article views including HTML views, PDF and ePub downloads, according to the available data) and Abstracts Views on Vision4Press platform.
Data correspond to usage on the plateform after 2015. The current usage metrics is available 48-96 hours after online publication and is updated daily on week days.
Initial download of the metrics may take a while.