Fig. 5
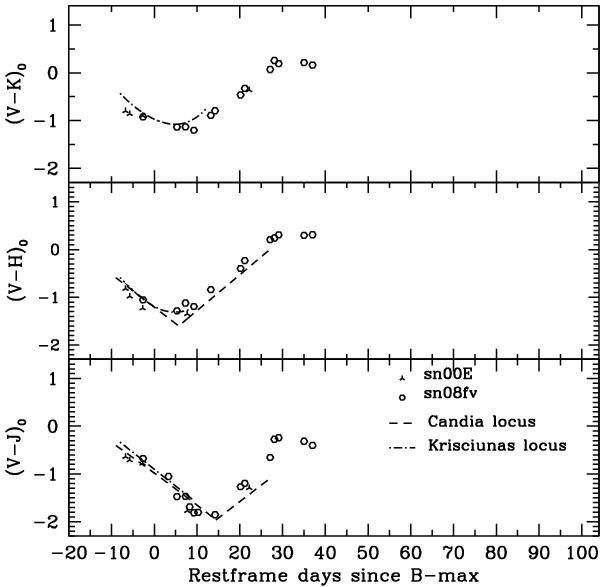
(V − J)0,(V − H)0 and (V − K)0 colour curves of SN 2008fv are plotted with the ones of the SN2000E. All data are corrected for the total Galactic+host reddening), by assuming the proper value for RV (see text). The NIR loci predicted by Candia et al. (2003) and Krisciunas et al. (2004c) are also plotted as dashed and dot – short dashed lines.
Current usage metrics show cumulative count of Article Views (full-text article views including HTML views, PDF and ePub downloads, according to the available data) and Abstracts Views on Vision4Press platform.
Data correspond to usage on the plateform after 2015. The current usage metrics is available 48-96 hours after online publication and is updated daily on week days.
Initial download of the metrics may take a while.