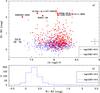
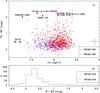
Fig. 1

a) Dependence of the W1 − W2 colour on the oxygen abundance 12+logO/H for a sample of ~1000 galaxies. Galaxies with Hβ luminosity L(Hβ) ≥ 3 × 1040 erg s-1, corresponding to SFR(Hβ) ≥ 0.7 M⊙ yr-1, are shown by red filled circles while galaxies with L(Hβ) < 3 × 1040 erg s-1 are shown by blue open circles. The NW and SE components of the low-metallicity BCD I Zw 18 are labelled and connected with a solid line. Newly identified galaxies with W1 − W2 > 2 mag are shown by large red filled circles, the three galaxies discussed by Griffith et al. (2011) are shown by large red filled squares. Typical error bars are shown in the lower right corner. b) Histograms of W1 − W2 distributions for galaxies with L(Hβ) ≥ 3 × 1040 erg s-1 (red dotted line) and with L(Hβ) < 3 × 1040 erg s-1 (blue solid line). c) and d) same as a) and b), respectively, but the sample is split into galaxies with EW(Hβ) ≥ 50 Å (red symbols and lines) and EW(Hβ) < 50 Å (blue symbols and lines).
Current usage metrics show cumulative count of Article Views (full-text article views including HTML views, PDF and ePub downloads, according to the available data) and Abstracts Views on Vision4Press platform.
Data correspond to usage on the plateform after 2015. The current usage metrics is available 48-96 hours after online publication and is updated daily on week days.
Initial download of the metrics may take a while.