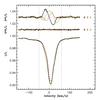
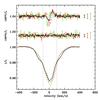
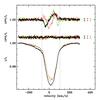
Fig. 1

LSD V (top), N (middle), and I (bottom) profiles of HD 130807 (left), HD 122451 (middle), and HD 105382 (right). The mean error bars are plotted next to each profile. The V and N profiles were shifted and amplified for clarity. The dotted vertical lines indicate the integration ranges for the calculation of Bℓ. Left: full black line: 28/05, red-dashed line: 27/05, green dot-dashed line: 23/05. Middle: full black line: 27/05, red-dashed line: 23/05, green dot-dashed line: 28/05. Right: full black line: 25/05, red-dashed line: 28/05, green dot-dashed line: 26/05.
Current usage metrics show cumulative count of Article Views (full-text article views including HTML views, PDF and ePub downloads, according to the available data) and Abstracts Views on Vision4Press platform.
Data correspond to usage on the plateform after 2015. The current usage metrics is available 48-96 hours after online publication and is updated daily on week days.
Initial download of the metrics may take a while.