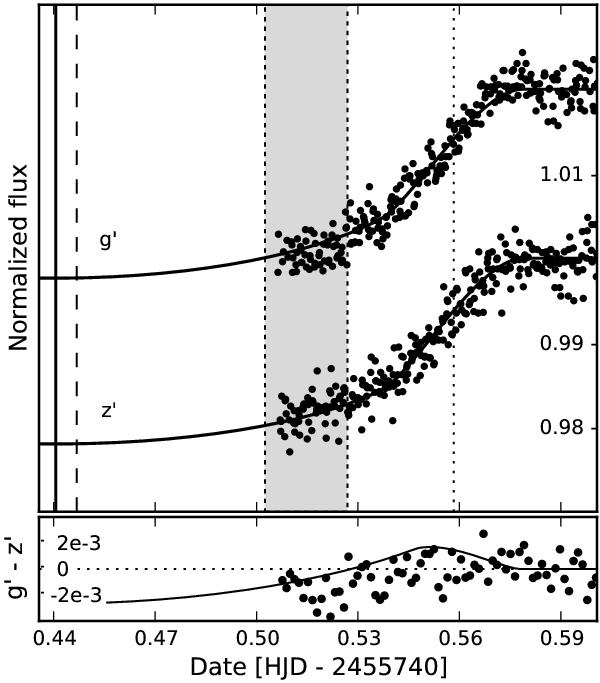
Fig. 1

GTC photometry of a transit of candidate KOI 806.02 in g′ (top) and z′ (bottom). The solid line is the fitted transit center and the dashed line its 3σ confidence limit, the shaded region defines the transit center ± 3σ predicted by B11, and the dotted line is mid-way through the egress. The time of transit center predicted by the ephemeris of B11 is 2 455 740.5146 ± 4.2 × 10⁻³, about 1.7h earlier. The lower figure shows the observed g′ − z′ during the transit egress, along with a modeled color signature using limb-darkening models from Claret & Bloemen (2011). The points shown are the mean of each 4 × 5 s exposure sequence.
Current usage metrics show cumulative count of Article Views (full-text article views including HTML views, PDF and ePub downloads, according to the available data) and Abstracts Views on Vision4Press platform.
Data correspond to usage on the plateform after 2015. The current usage metrics is available 48-96 hours after online publication and is updated daily on week days.
Initial download of the metrics may take a while.


