Free Access
Fig. 4
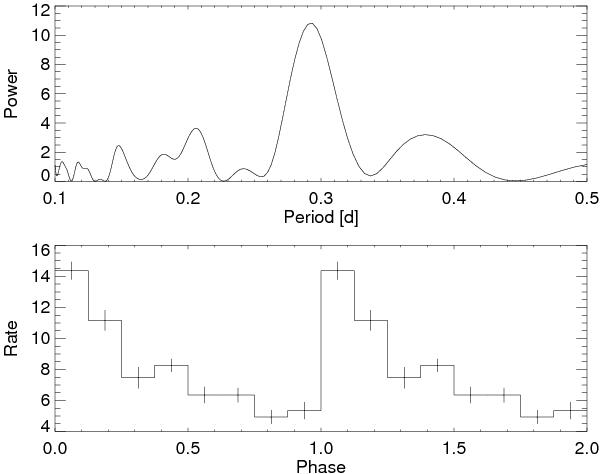
Top: Lomb-Scargle periodogram of the “flaring” part of EXO 2030+375 light curve (between MJD 55 518.5 and 55 521.5). The peak around ~ 0.3 d is clearly seen. Bottom: “Flaring” part of the light curve folded with best period found from the periodogram (0.293 d).
Current usage metrics show cumulative count of Article Views (full-text article views including HTML views, PDF and ePub downloads, according to the available data) and Abstracts Views on Vision4Press platform.
Data correspond to usage on the plateform after 2015. The current usage metrics is available 48-96 hours after online publication and is updated daily on week days.
Initial download of the metrics may take a while.