Free Access
Fig. 3
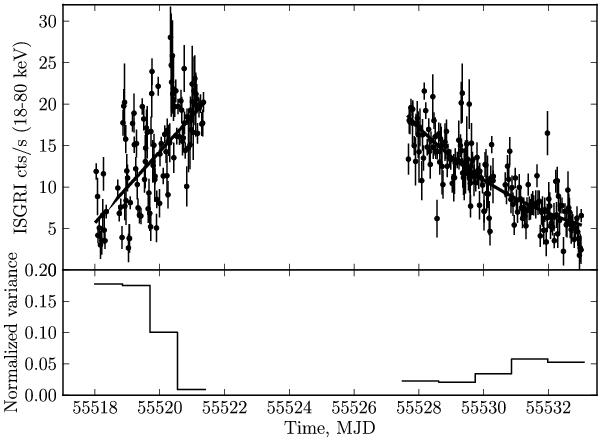
Top: ISGRI light curve of the EXO 2030+375 outburst approximated with a polynomial function (solid curve) which represents the averaged evolution of the flux. Bottom: normalized excess variance of the source flux with respect to the polynomial function.
Current usage metrics show cumulative count of Article Views (full-text article views including HTML views, PDF and ePub downloads, according to the available data) and Abstracts Views on Vision4Press platform.
Data correspond to usage on the plateform after 2015. The current usage metrics is available 48-96 hours after online publication and is updated daily on week days.
Initial download of the metrics may take a while.