Free Access
Fig. 2
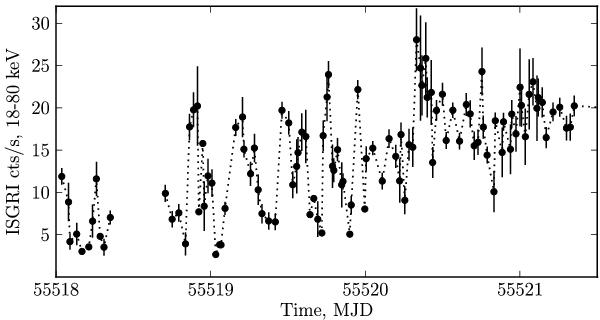
INTEGRAL/ISGRI light curve of EXO 2030+375 during the rise of its normal outburst in Nov.–Dec. 2010. The flaring activity is clearly seen. The light curve of the entire outburst is shown in Fig. 3. One Crab corresponds to ~ 260 cts/s in the specified energy range.
Current usage metrics show cumulative count of Article Views (full-text article views including HTML views, PDF and ePub downloads, according to the available data) and Abstracts Views on Vision4Press platform.
Data correspond to usage on the plateform after 2015. The current usage metrics is available 48-96 hours after online publication and is updated daily on week days.
Initial download of the metrics may take a while.