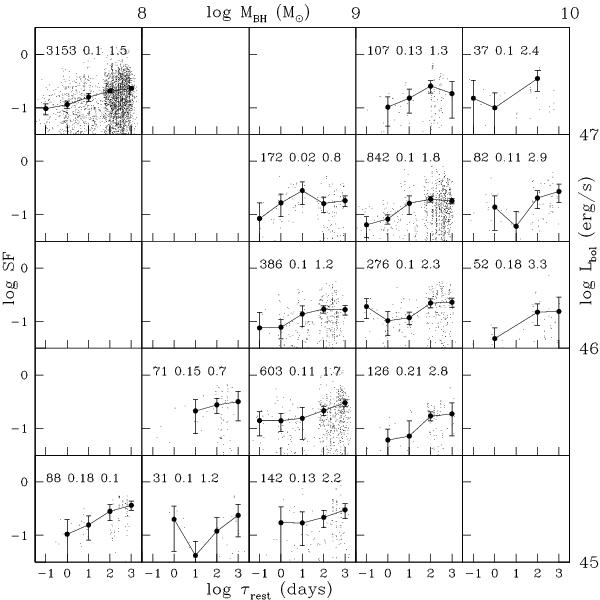
Fig. 9

Structure function for XMM-Newton subsamples binned in intervals of log MBH and log Lbol, with bin width Δlog MBH = Δlog Lbol = 0.5. Values of MBH and Lbol are reported in the upper and right axes, respectively. Subsamples with less than 30 SF points are not shown. The SF of the total XMM-Newton sample is reported, for comparison, in the first box in the upper left corner. The values reported in each box are the number of SF points, the average SF slope, and the expected value of log τbreak, according to Eq. (6). Contributions from pairs of individual measurements are also shown (dots).
Current usage metrics show cumulative count of Article Views (full-text article views including HTML views, PDF and ePub downloads, according to the available data) and Abstracts Views on Vision4Press platform.
Data correspond to usage on the plateform after 2015. The current usage metrics is available 48-96 hours after online publication and is updated daily on week days.
Initial download of the metrics may take a while.


