Fig. 5
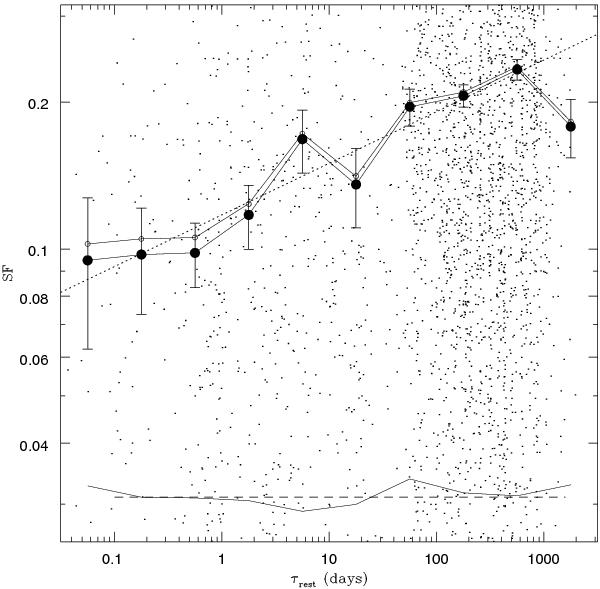
Structure function for the XMM-Newton sample in bins of Δlog τ = 0.5. The small empty circles and the continuous line connecting them show the uncorrected SF (i.e., neglecting σn in Eq. (1)). The larger filled circles and the line connecting them, show the SF corrected for the noise. The continuous line without data points indicates the average value of the noise in each bin, and the dashed, horizontal line is its weighted average, according to the number of points in each bin, adopted in Eq. (1). The dotted line is a weighted least-squares fit to the data of the bins. The small dots are the contributions from pairs of individual measurements at times differing by τ.
Current usage metrics show cumulative count of Article Views (full-text article views including HTML views, PDF and ePub downloads, according to the available data) and Abstracts Views on Vision4Press platform.
Data correspond to usage on the plateform after 2015. The current usage metrics is available 48-96 hours after online publication and is updated daily on week days.
Initial download of the metrics may take a while.