Fig. 3
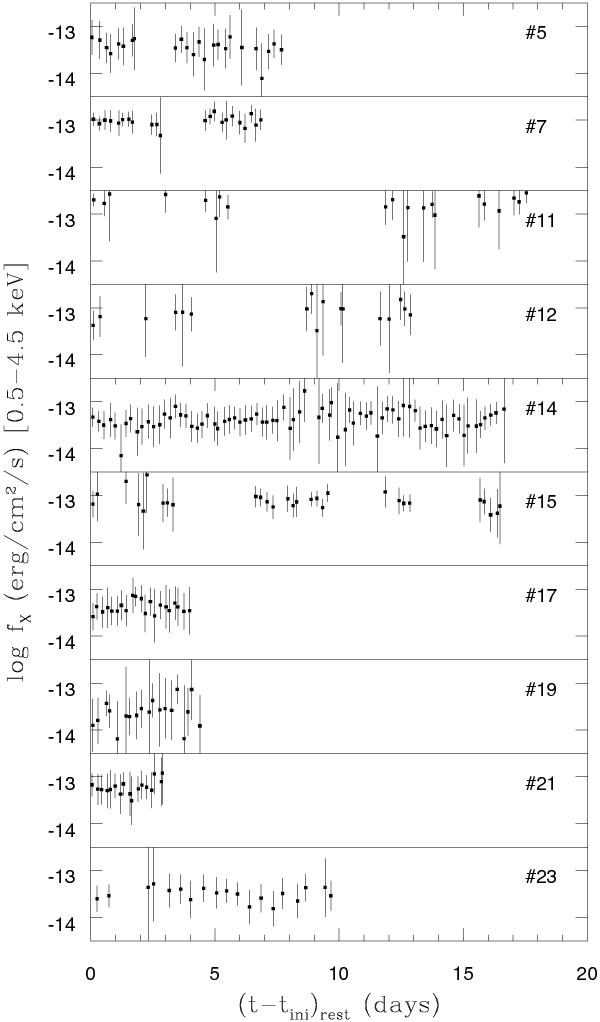
Some of the best-sampled light curves from the Swift sample. Times are counted from the initial epoch of each light curve, in the rest-frame. Errors proportional to the inverse square root of the photon count at each epoch are displayed as 3-σ values. Errors are discussed in more detail in Sect. 3. Source numbers from Col. 1 of Table 2 are indicated.
Current usage metrics show cumulative count of Article Views (full-text article views including HTML views, PDF and ePub downloads, according to the available data) and Abstracts Views on Vision4Press platform.
Data correspond to usage on the plateform after 2015. The current usage metrics is available 48-96 hours after online publication and is updated daily on week days.
Initial download of the metrics may take a while.