Fig. 8
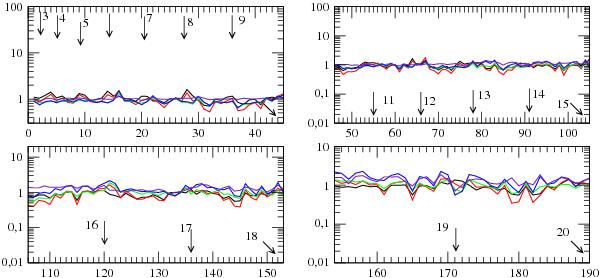
At T = 1600 K, ratios of effective de-excitation rate coefficients (Eq. (3)) from the 1st to the 190th de-excitation transition of para-H2O:  /
/ (black),
  / (red), / (green),
  / (blue), and / (indigo). The abscissae indicate the labeling of the de-excitation transitions as given in Table 4 of Daniel et al. (2010). The arrows combined with their label “n” indicate the transition n → n − 1.
Current usage metrics show cumulative count of Article Views (full-text article views including HTML views, PDF and ePub downloads, according to the available data) and Abstracts Views on Vision4Press platform.
Data correspond to usage on the plateform after 2015. The current usage metrics is available 48-96 hours after online publication and is updated daily on week days.
Initial download of the metrics may take a while.