Fig. B.1
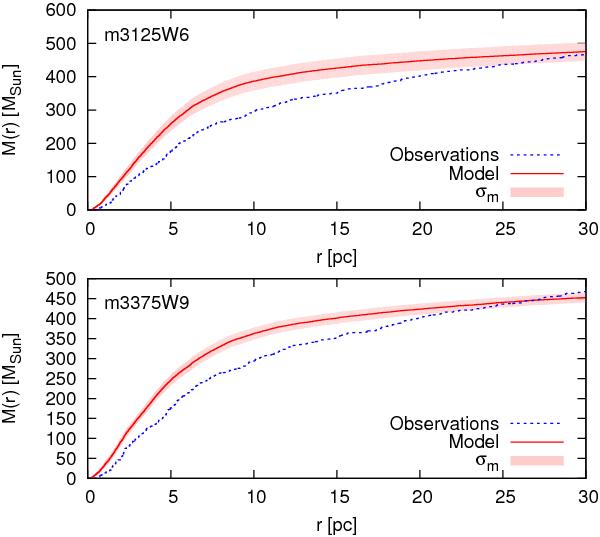
Comparison of the cumulative mass profiles of observations and ensemble of models. The thick solid (red) lines in the middle for the model represent the mean that is ensemble-averaged over 15 runs. The standard error of the mean for the ensemble is shown as a filled area. The dashed (blue) line is calculated from the observational data. Top: ensemble of models en3125W6. Bottom: ensemble of models en3375W9.
Current usage metrics show cumulative count of Article Views (full-text article views including HTML views, PDF and ePub downloads, according to the available data) and Abstracts Views on Vision4Press platform.
Data correspond to usage on the plateform after 2015. The current usage metrics is available 48-96 hours after online publication and is updated daily on week days.
Initial download of the metrics may take a while.