Fig. 13
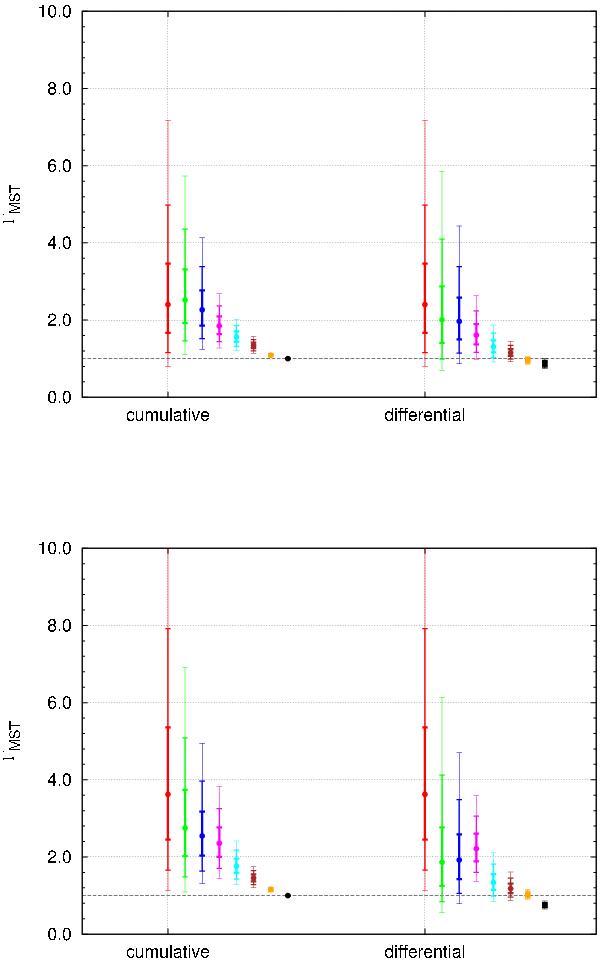
Comparison of present-day mass segregation between models and observations. Top figure: analysis of the evolved (for 625 Myr) ensemble en3000W6. Bottom figure: analysis of the observational data of Röser et al. (2011). Each single plot contains on the left-hand side the “cumulative” ΓMST (points) for the 5 (red), 10 (green), 20 (blue), 50 (magenta), 100 (cyan), 200 (brown), 500 (orange), and all most massive stars (black). The right-hand side shows the “differential” ΓMST (points) for the 5 (red), 6 − 10 (green), 11 − 20 (blue), 21 − 50 (magenta), 51 − 100 (cyan), 101 − 200 (brown), 201 − 500 (orange), and 501-all most massive stars (black). The error bars mark the 1, 2, and 3σ uncertainties. A value of one marks the unsegregated state.
Current usage metrics show cumulative count of Article Views (full-text article views including HTML views, PDF and ePub downloads, according to the available data) and Abstracts Views on Vision4Press platform.
Data correspond to usage on the plateform after 2015. The current usage metrics is available 48-96 hours after online publication and is updated daily on week days.
Initial download of the metrics may take a while.